The R1 Activity Dashboard provides instant, actionable insights into instance-wide performance, availability, and throughput. From a single location, understand the state of the system, the quality of the end user experience, and the status of business-critical operations all within Relativity’s secure cloud platform.
The RelativityOne (R1) Metrics Dashboard project has been a whirlwind ride. Initially pitched as an exciting, “quick win” to headline the keynote presentation at our annual user conference, the project quickly has taken on a life of its own. In two short months, we went from hallway conversations, to crunching for a live keynote demo, to beta release and customer roll-out.
RelativityOne is a secure, cloud-based e-discovery platform with the elasticity and international reach to automatically scale on-demand. The goals of the project are three-fold:
As the lead—and sole!—designer on the project, I am responsible for all aspects of the end-to-end product design life cycle, including: user research, design exploration, feature definition, wireframes, click-able prototypes, high fidelity mockups, production assets, usability testing and validation.
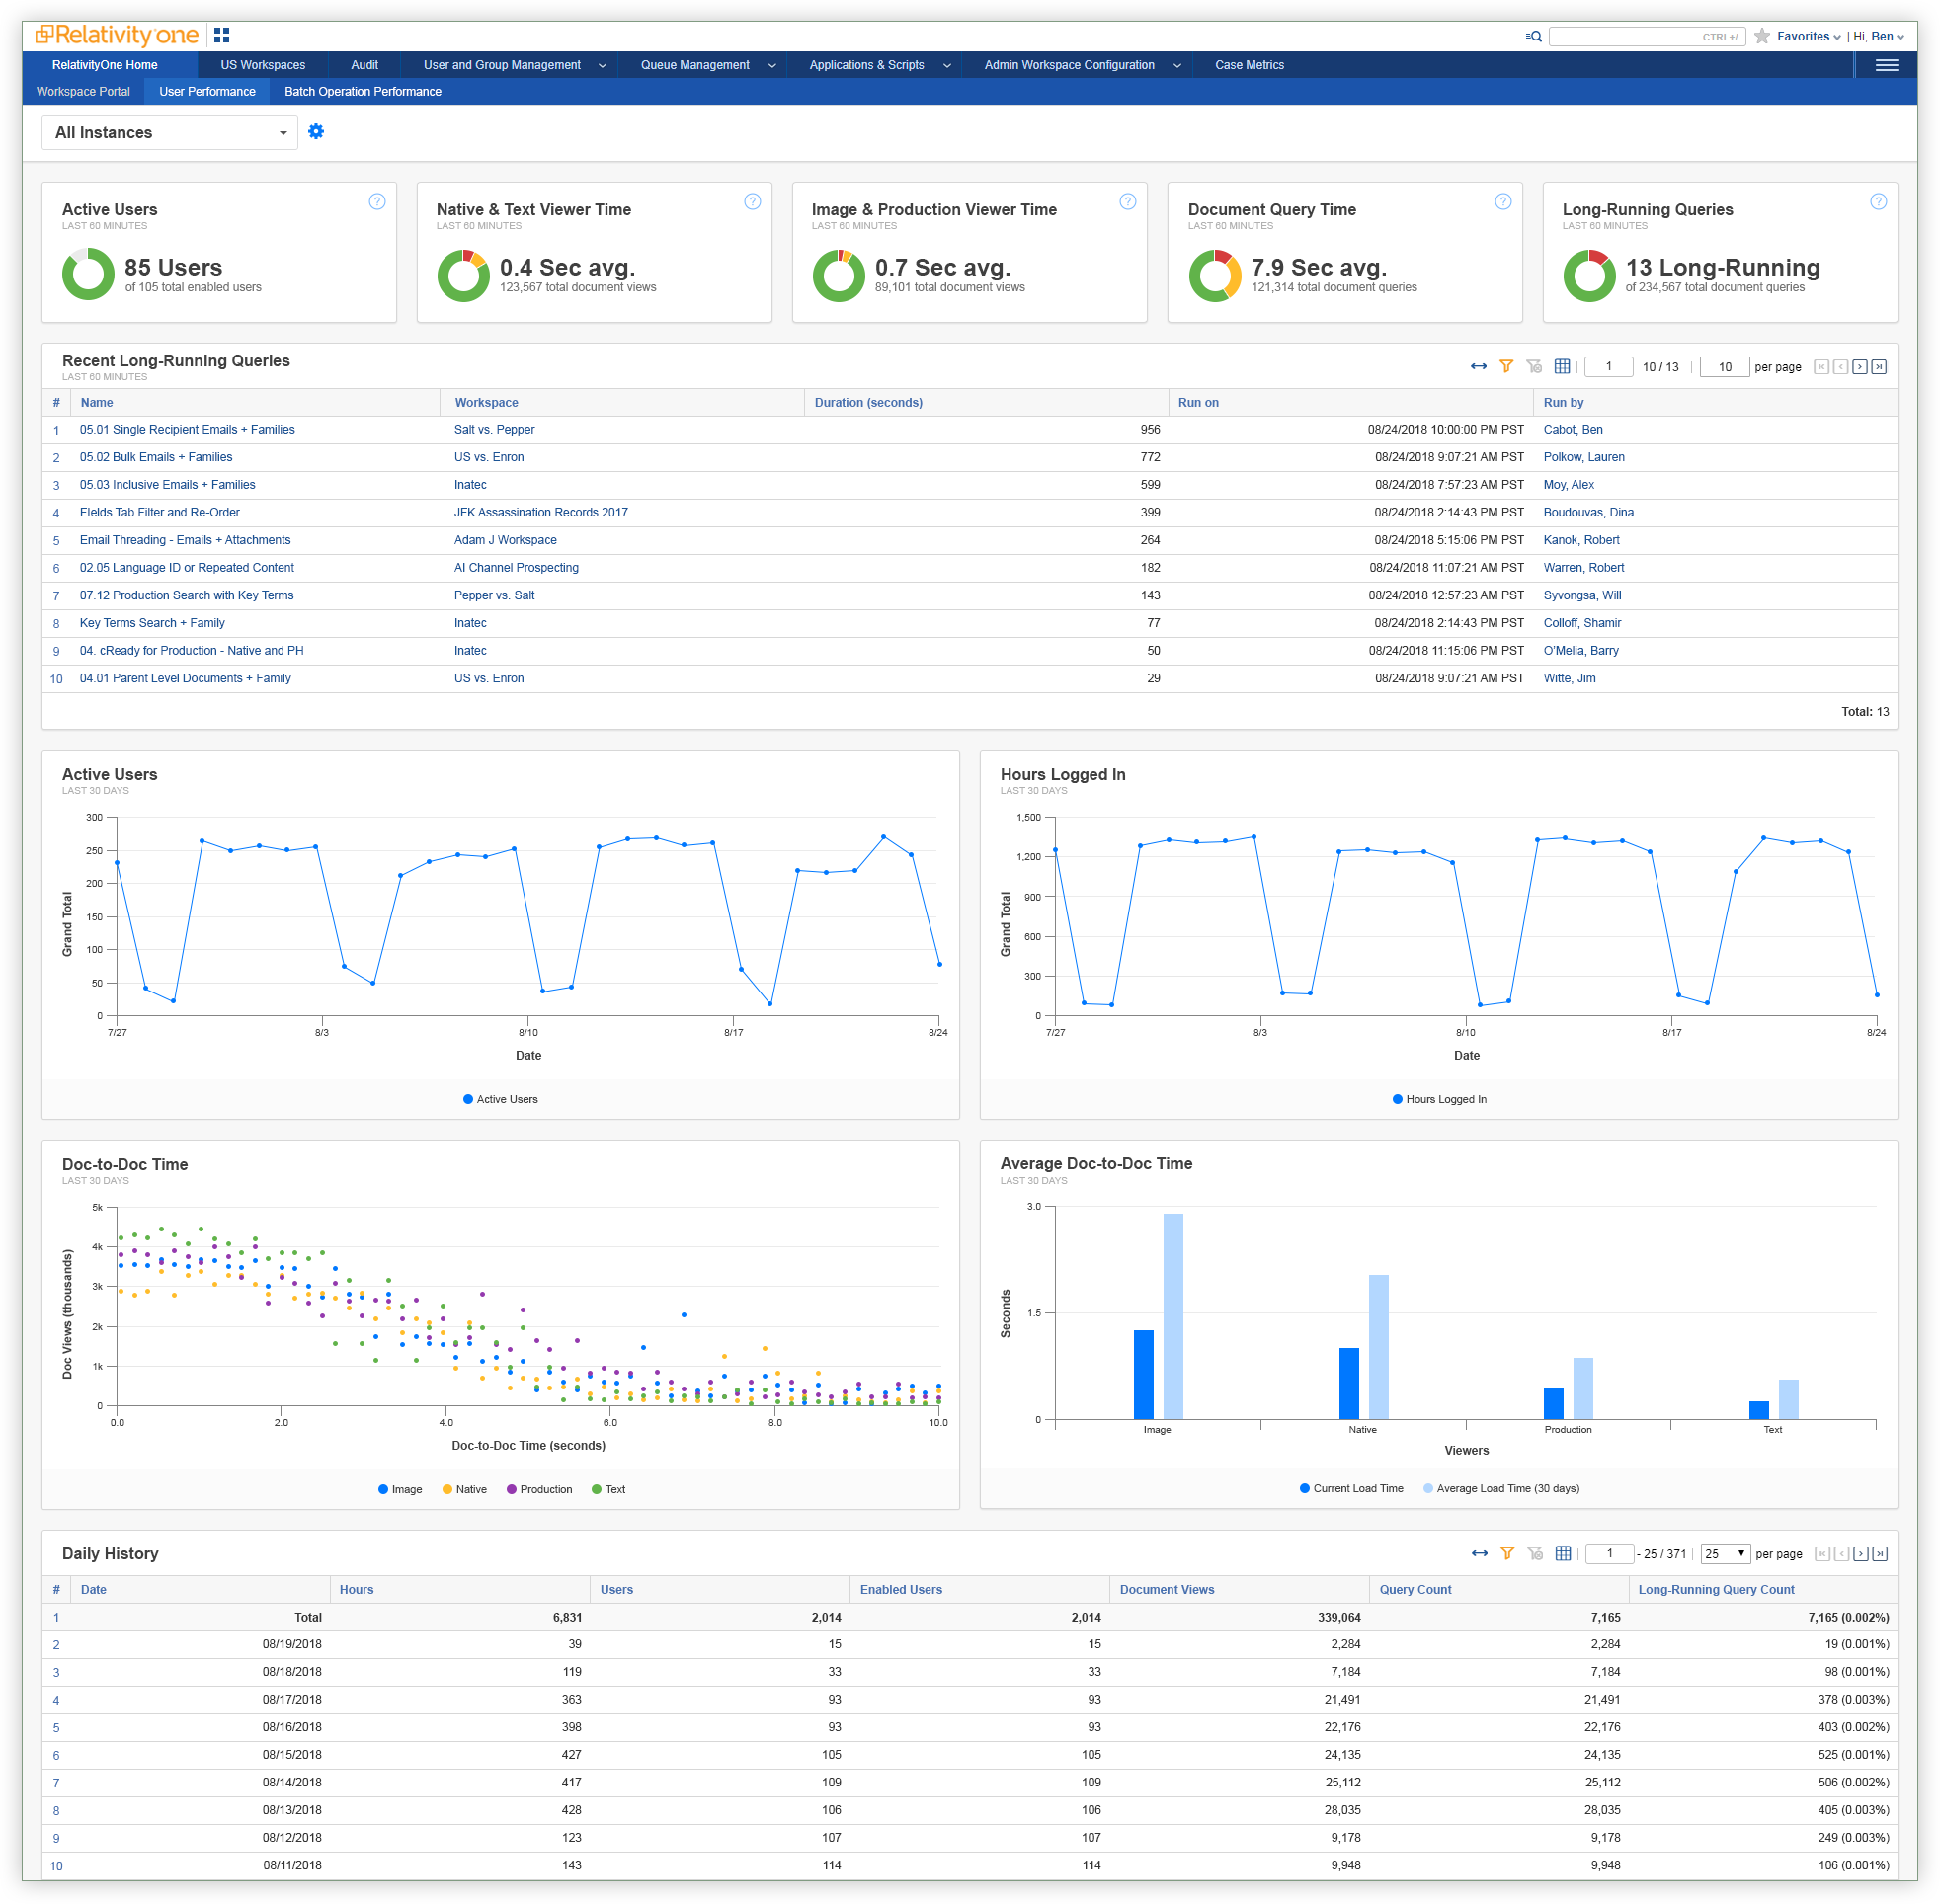
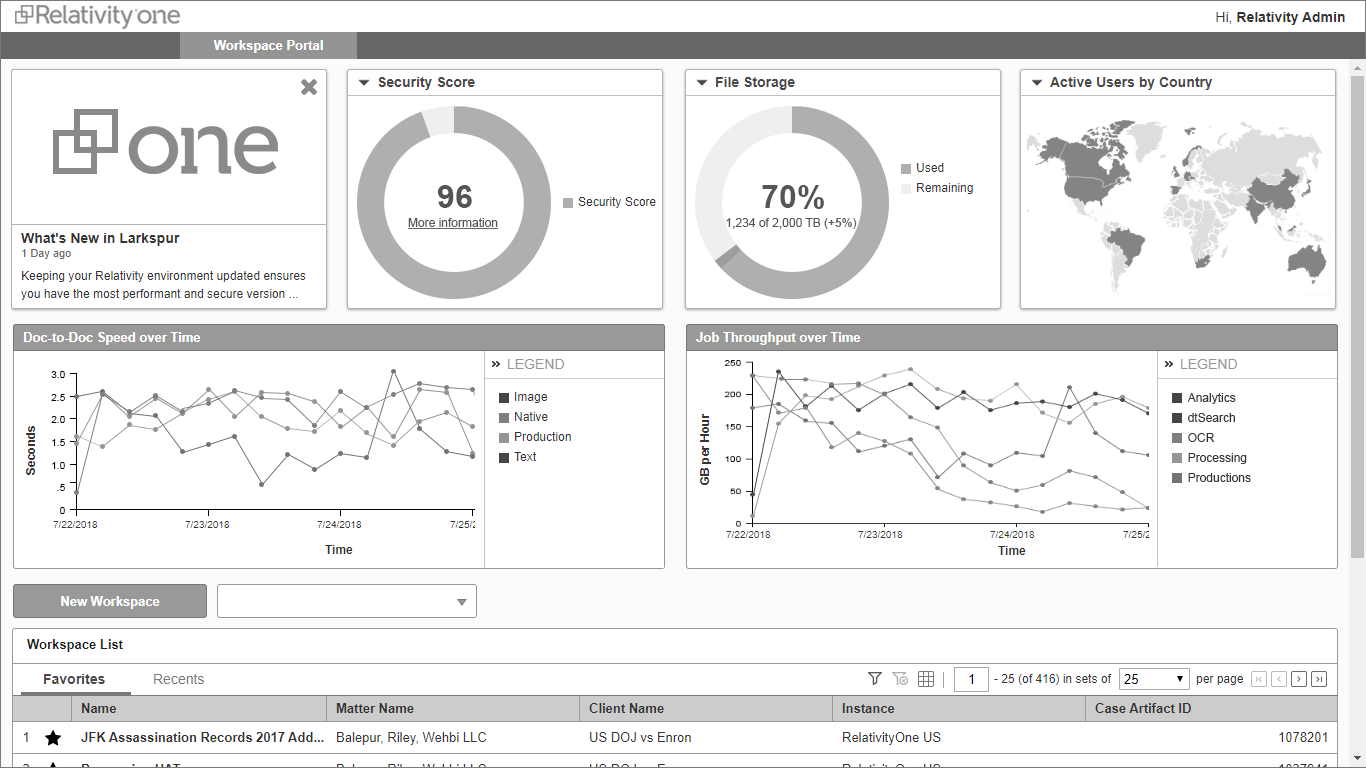
The RelativityOne Metrics Dashboard provides Case Admins and IT Professionals immediate insights into the performance, throughput, and overall health of all of their global instances from a single place: a “single pane of glass.” Pulling from a variety of data sources, it is broken up into two primary views: User Performance and Batch Operations.
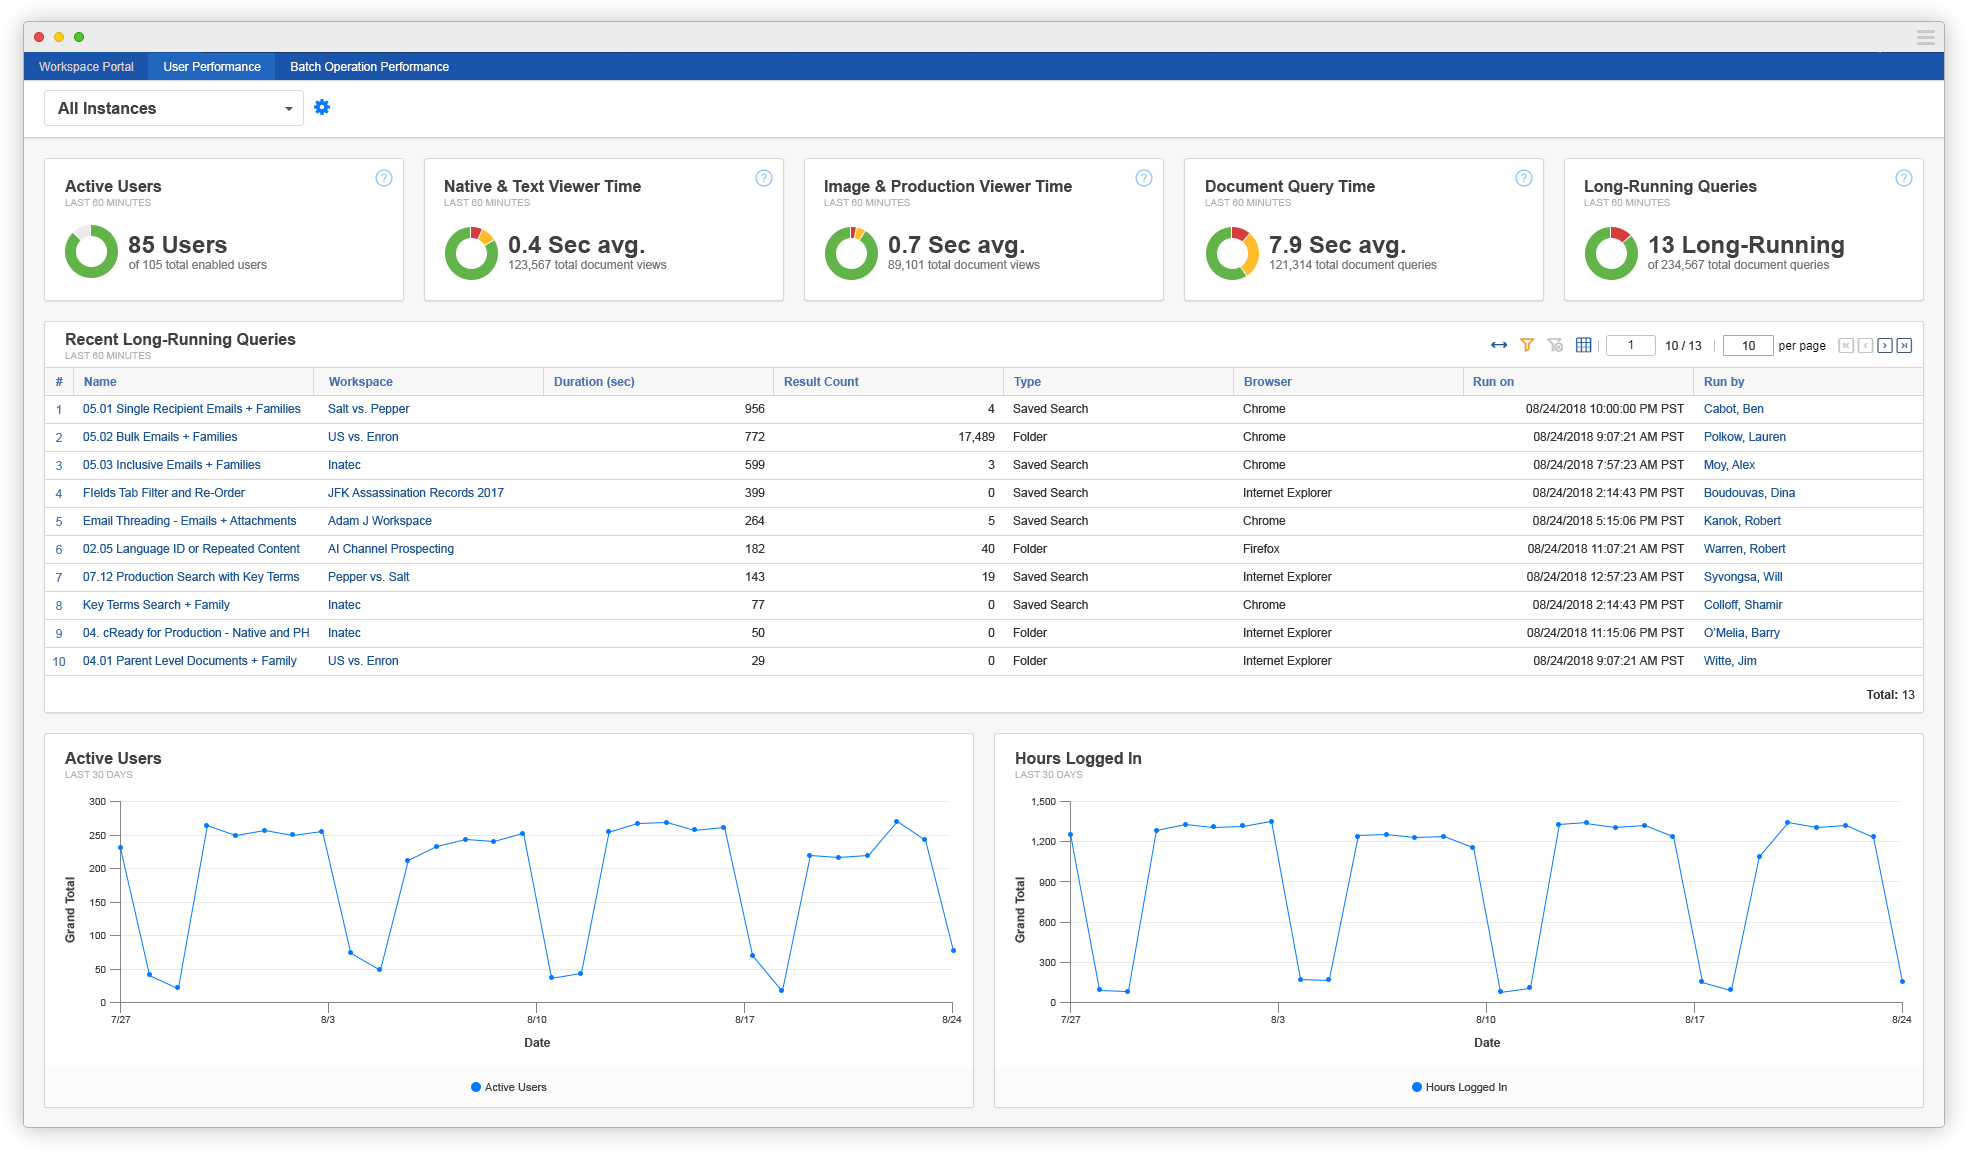
The User Performance tab is focused exclusively on understanding a user’s experience in the system and identifying potential pain points before they happen. High-level “traffic light” widgets give an at-a-glance understanding of the most impactful performance metrics: doc-to doc times, page load times, and long-running queries.
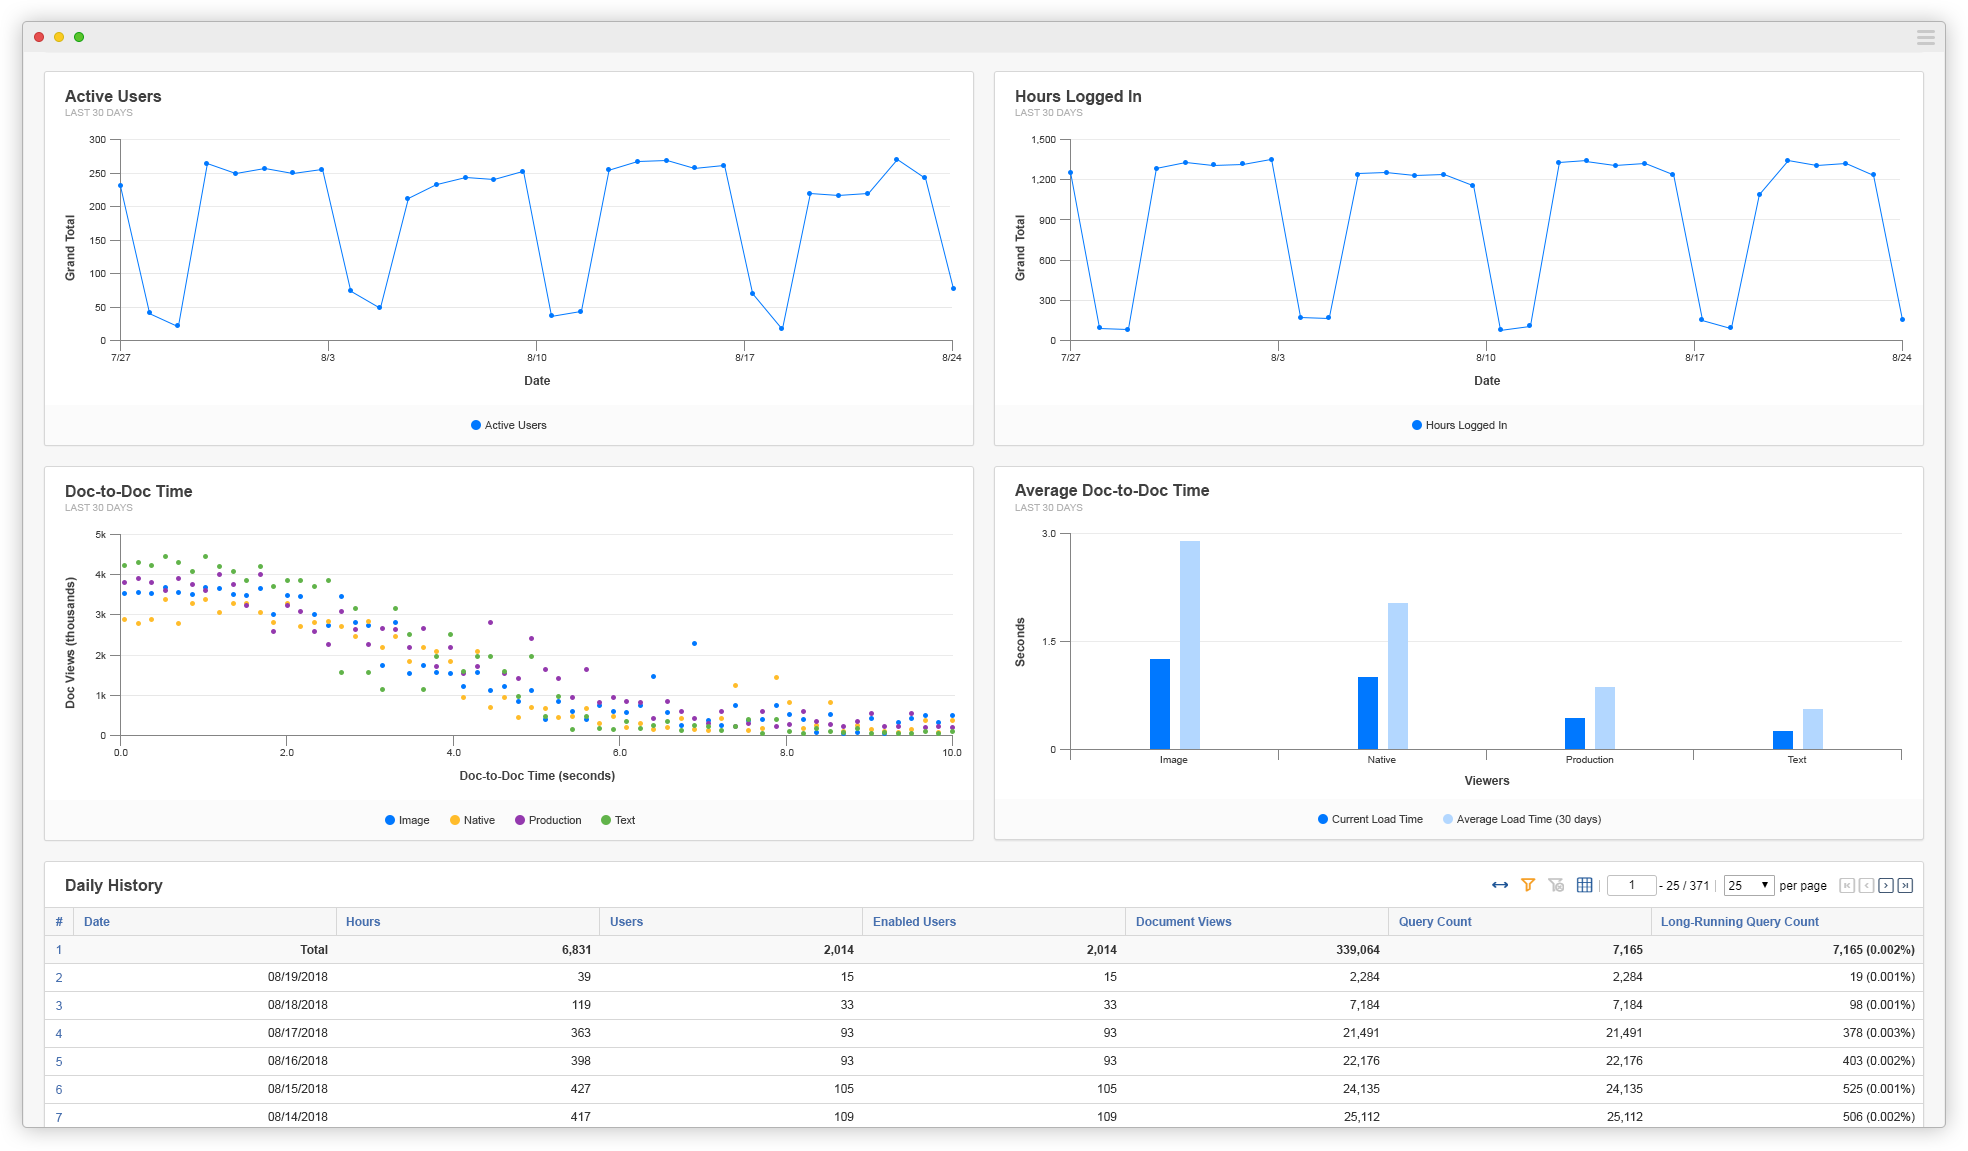
Historical data detailing user activity puts current performance in context and illuminates patterns across time segments and review types.
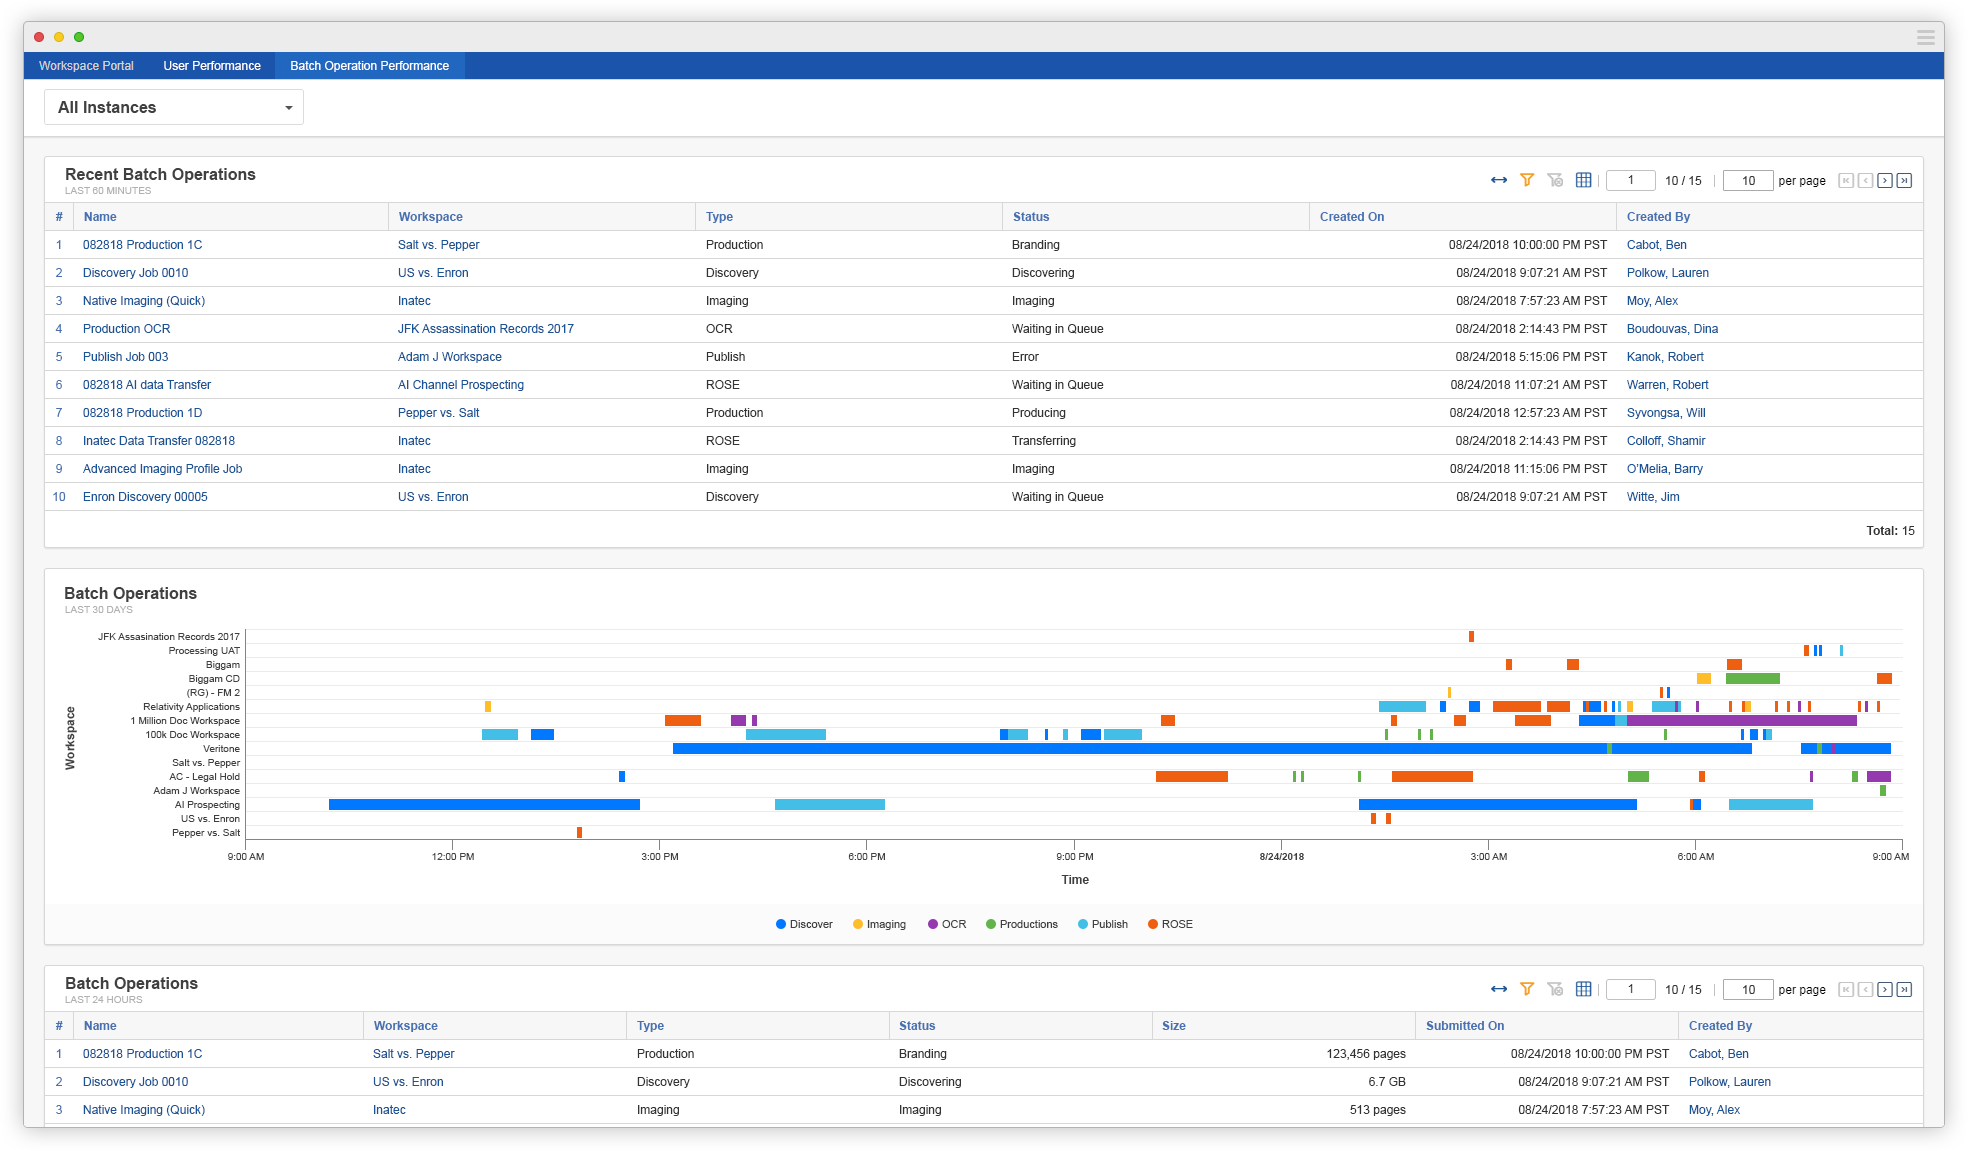
Batch Operations are the workhorse of the Relativity platform, but managing them across multiple busy instances can be an intimidating task. The Batch Operations Gantt chart gives a top-down view of all jobs across all workspaces.
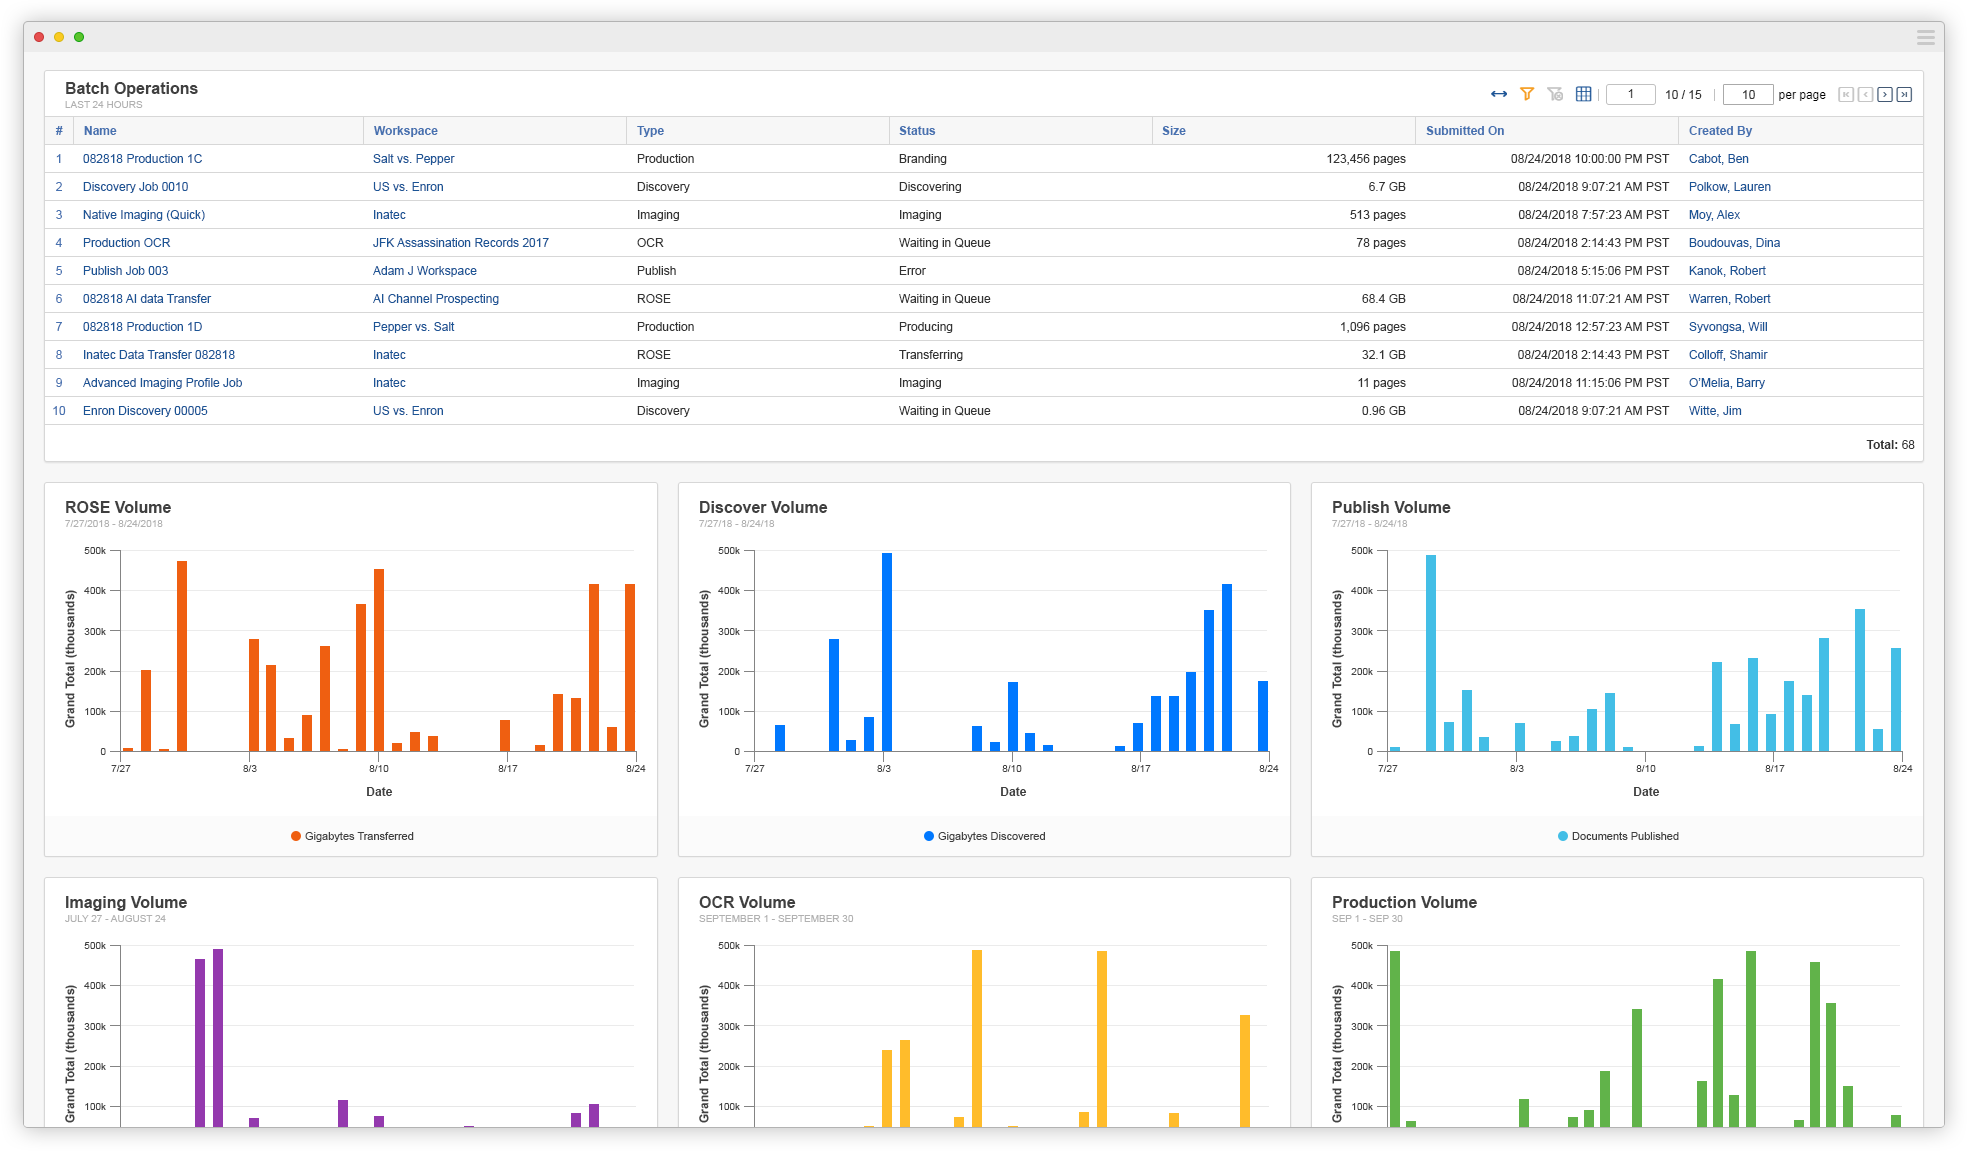
The Batch Operations and Daily History tables give you a rollup of historical job information allowing for painless QC. The Job Throughput charts put the power of R1 on display—and aide in troubleshooting when it’s not.
Being such a high profile project on such a tight timeline, we have had to go fast, fail quickly, and iterate often. Being in constant contact with PM, engineering, our internal buisness intelligence team, executive leadership, and users has provided a steady feedback loop that has informed our decision making and driven our development.
We worked at a fever pitch to get everything designed, validated, built, and tested, but ultimately came up short for our keynote deadline. At the eleventh hour—literally 7:00 AM the morning of the keynote presentation—the R1 Metrics Dashboard was pulled from the agenda. It was a discouraging, but the team rebounded immediately. We used the conference as an avenue to solicit more feedback, build excitement, and recruit.
Immediately following the conference, the team got together and assembled an action plan to shore up the product and get it ready for it’s beta release in two weeks.
We officially reached beta release and installed the application in our first client environment just prior to this writing, but our work is only beginning! From the beginning, the goal has been to deliver unique value for our customers and increase adoption of RelativityOne, but our approach has been to learn and iterate quickly. We view this release as equal parts product and learning tool; we are going to partner with our users to tinker, tweak, refine, and add on to our humble dashboard. In fact, we've already gotten some initial feedback and have started to roll out improvements (I'm looking at you, Gantt chart).
With our current beta client (as well as the additional four upcoming) we have recurring syncs scheduled to review the product, analyze data, and gather feedback. The initial response has been incredibly positive, but I am looking forward to creating something truly special.